CHART STUDIO
Designed and built an AI-assisted internal tool that reduced chart production from 30 minutes to five.
OVERVIEW
Chart Studio is an internal tool I designed and built for Chaptrs to simplify the production of recurring performance charts. It turns monthly data into consistently styled charts that can be exported as high-resolution PNG, PDF and SVG files.
Disclaimer: All metric names, dates and figures have been replaced with representative data for confidentiality.
My Role
Design Lead
BUILT WITH
ChatGPT
TOOLS
Figma, Python, ChatGPT
TIMELINE
1 week
THE PROBLEM
Producing recurring performance charts involved a repetitive and technical process that was slow to update, difficult to maintain and vulnerable to inconsistencies.
What should have been a simple two-minute update became a tedious 30-minute task.
At the end of each month, I update Chaptrs’ performance graphs for the official pitch deck, which has always been designed in Figma for easy collaboration. However, every chart required manual adjustments as it was originally designed from scratch. I tested Excel which introduced visual inconsistencies and issues with quality, while tools such as Graphy required another paid subscription.

Examples of Chaptrs’ monthly performance graphs, manually updated in Figma. All metric names, dates and figures have been replaced with representative data for confidentiality.
AI made chart creation faster, but not consistent. It was a continuous back and forth editing and amending.
Before testing, I removed all references to Chaptrs and any labels that could identify the metrics, sharing only decontextualised figures and chart specifications. Despite providing a visual reference and clear design constraints, the outputs remained inconsistent, revealing the need for a more controlled solution.

Edited excerpt from early ChatGPT testing. Company identifiers and metric context were removed before testing; the names and figures shown here have also been replaced for confidentiality.
Instead of prompting ChatGPT every time to produce charts, could I build a software that produced charts at the press of a button?
Through further discussions with ChatGPT, I explored a more reliable approach: building a dedicated internal tool with Python that had Chaptrs’ visual design rules embedded into it. This would produce consistent charts from new data without manually redesigning them each time.

The conversation that introduced the idea of replacing repeated chart prompts with a reusable internal tool.
Without coding experience, I used AI to turn my product requirements into a working MVP.
1
I defined the MVP
Specified the design rules, data handling and required export formats.
Select a chart
→
Add or amend data
→
Preview the output
→
Export
2
ChatGPT supported the build
Translated the requirements into a Python script and provided setup guidance.
3
I installed and tested it
Ran the script locally with real data and checked the exported charts.
4
The MVP proved the idea
The charts worked, but the workflow needed easier data updates, live previews and additional controls for visual customisation.
Testing the MVP with real data revealed the features needed for a more usable and flexible workflow.

All dates and figures have been replaced with representative data for confidentiality.
Features needed to improve usability
Modify existing data and add new data
See live previews of the chart
Modify font sizing and spacing if needed
A faster, repeatable way to create every chart.
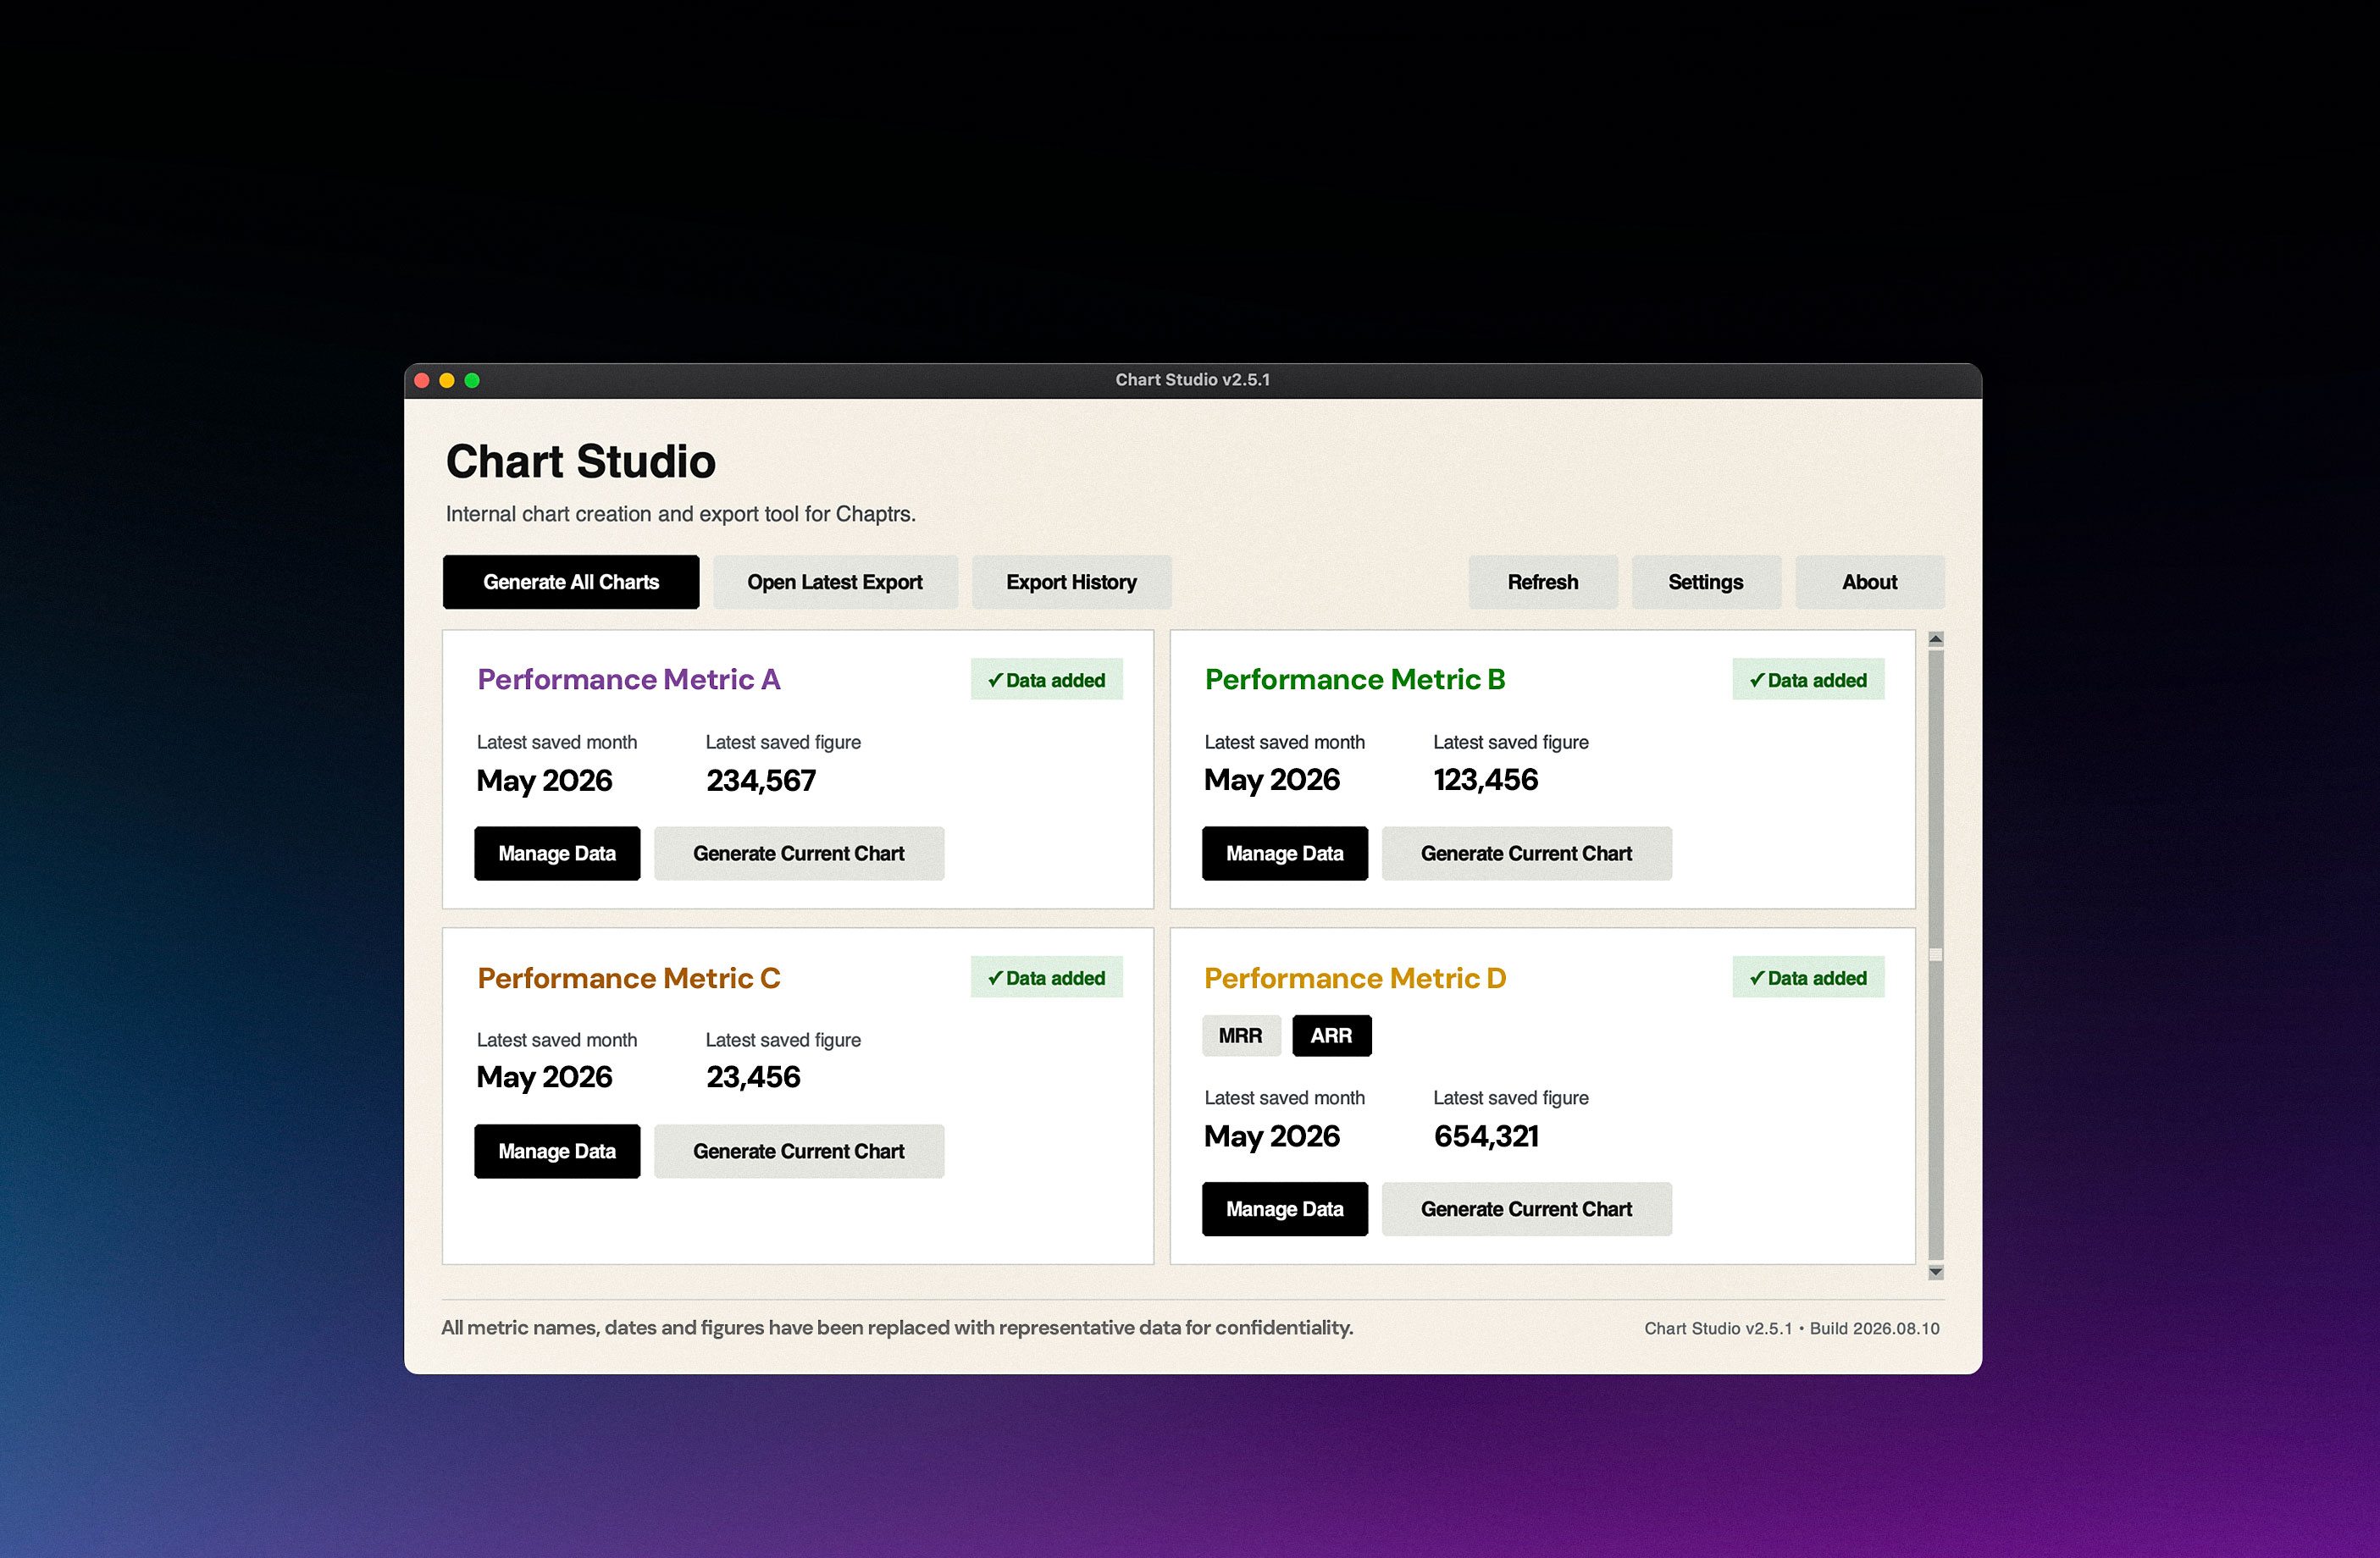
Chart Studio turns updated performance data into consistently styled, presentation-ready charts. Users can manage data, preview changes and export high-resolution PNG, PDF and SVG files through one streamlined workflow.
Disclaimer: All metric names, dates and figures have been replaced with representative data for confidentiality.

Chart Studio's default screen when opened.

Chart Settings window within Chart Studio. Here the user can adjust the spacing, font space and decide whether to include a background or not.

Manage Data window within Chart Studio. This window allows the user to edit data for an existing month or add data for a new month.